
Gold: What We’re Up To…
Development of Geegeez Gold into a form provision for all punters, regardless of time, experience or desired level of engagement, is ongoing. From the outset, we’ve sought to differentiate from other form books by using more visual indicators, and aggregating data for expediency purposes. Nowhere is this more obvious than in the Instant Expert view.

More configurability is now yours with Instant Expert v2.0
We recently gave Instant Expert its first nip and tuck – more collagen injection than full cosmetic surgery – by introducing additional filters for time period, race code, and handicaps/all races. And we continue to make progress with the Query Tool, though that has been a little slower than ideal.
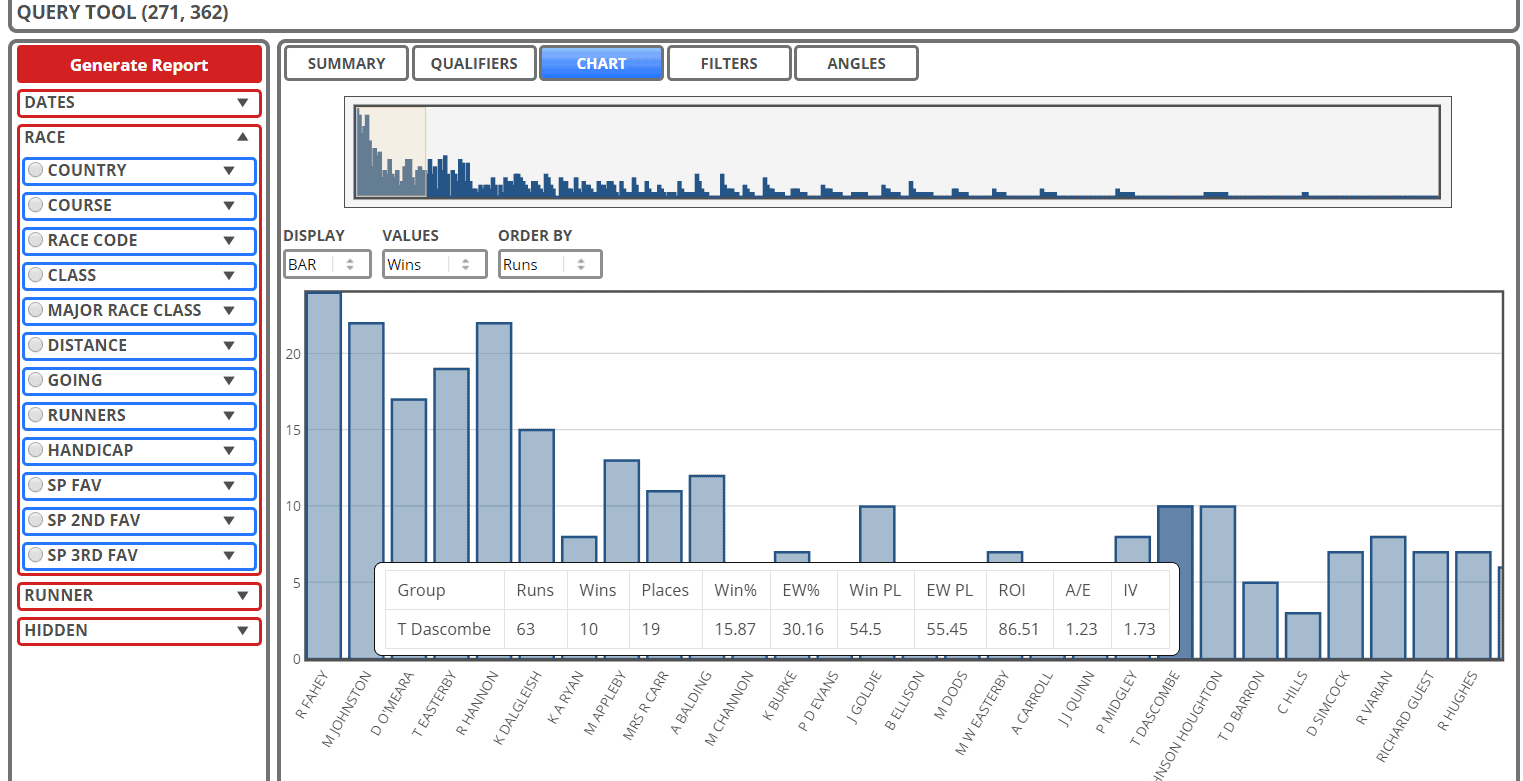
Basic charting functionality in geegeez.co.uk Query Tool
The pipeline for Gold development has a long route to travel, flowing as it does from the contents of the darker crevasses of my creaking cranium, via a couple of wildly talented but somewhat maverick developers, into the estuary of our test site, and finally onto the live website here.
We use a few collaboration tools to manage that flow, and in the remainder of this post I will share some of what currently resides there.
But first a warning…
Before I share what next, I need to warn you of the very next thing we’re undertaking.
As Geegeez Gold has grown, both in terms of functionality and user numbers, so the requirement for computing power has grown too. Also, time has passed since we kicked this off in 2013, and the server we were using then is no longer up to the job.
We need http2, and fast-cgi, and SSD, and TLS 2.1 and other acronyms that I don’t fully understand but have on good authority will enhance both the stability of the site – which, in truth, has been disappointing in the past month or so – and the speed of access for users. Oh, and of course, the new box will further improve security.
It’s a hideous job, fraught with peril and, to be blunt, I’ve been sh!tting myself about doing it for more than two years now. But it cannot be ignored any longer. We are currently in the process of building the new server – a process that has complexity relating to the various inputs we have, as well as code and data challenges, etc etc blah blah.
From your perspective, you just need it to work and, in an ideal world, to work a little faster. Our job is to make that happen. We’re on it, and we’ll likely be switching in the next fortnight or so. *dons tin hat, and assumes the brace position*
Then what?
Once we’ve migrated to the new whizzbang (more whizz less bang, I hope) server, we can get back to the fun stuff. Here’s what’s in store, though keep in mind that not all of it will necessarily see the light of day: the features we’re considering range from ‘must have’ to Coleridgesque opiate-addled fantasy!
Here we go then…
– Calculate and publish overrounds for races (general excitement level: yawn)
– QT: make ‘group by’ links clickable (general excitement level: useful)
– QT: add ‘tool tips’ to explain stuff (general excitement level: yawn)
– QT: add Speed Rating Rank to allow analysis of the effectiveness of the figures (general excitement level: cool)
– QT: add damsire (general excitement level: mildly interesting)
– QT: allow users to save queries within QT (general excitement level: awesome!)
– QT: allow users to view saved query qualifiers on the racecard (general excitement level: totes amazeballs!)
– QT: add Equipment Count (e.g. blinkers first time) (general excitement level: interesting)
– QT: add Wind Count (e.g. first run after wind op) (general excitement level: mucho interesting)
– QT: add last run info (days since, class, course, distance, etc) (general excitement level: very useful)
– Then What?: add class distinction to ‘then what?’ form follow in racecard (general excitement level: useful)
– Top SR Differential report: highlighting the horses furthest clear of their fields each day (general excitement level: interesting)
– Export report output to Excel (general excitement level: nice touch)

– TJ Combo report: add one year trainer/jockey sub-report (general excitement level: very useful)
– Class Move report: new report, with an option to display class move indicators on racecard (general excitement level: useful)
– Racecard menu filters: only interested in sprint handicaps? See only the races you’re fussed about (general excitement level: niche)
– Instant Expert: add draw position (general excitement level: very useful for flat races)
– Instant Expert: create trainer/jockey/sire options, if possible (general excitement level: awesome)
– Ratings pars: calculate and publish ratings pars for course/distance/class combinations (general excitement level: interesting)
And now for something completely different…
Lots of interesting bits there, most of them of interest to Peter but not Paula, or Paula but not Peter, if you see what I mean. Alongside all of that, I am working on a couple of more mechanical features, which are, to be frank, no better than even money to see publication. For interest, then, these are they…
-
Sprint Handicap Form Cheat Sheet
I recently read an old book called Betting on Flat Handicaps, by Jon Gibby. It was published fifteen years ago and, since then, much of the draw and pace data in the book has become outdated. Luckily for us, Geegeez Gold has permanently current data for both of those elements which, applied to the excellent regimen espoused in Gibby’s book, provides a very solid framework for form study in such races.
Nothing about his approach is earth-shattering or rocket science, but all of it represents common sense fundamental principles. Gibby, who focuses primarily in sprint handicaps, goes about eliminating a section of the field based on where they are drawn. For the remaining runners he digs into the form book. See, I told you it wasn’t rocket science. That it is effective should not be surprising.
I’ve been looking at a race or two a day, when I have time, and my results in this ‘testing phase’ are below.

Very (very!) early days, but a good start
Now, straight off the bat it needs saying that a 40% strike rate is unsustainable, still less when two of those winners were at double digit odds. So let’s be realistic here: there’s a solid chance of a protracted losing sequence coming next for the test. What I’m looking for in this incubator phase is some sort of affirmation for the process. I want the picks to largely run well, or with legitimate excuses; and I want unbacked winners to generally have been on my shortlist.
If after 50 bets – still a small sample but data-driven betting on racing is usually based on small samples – that’s the general feel I’m getting, it’ll be time to engage a little more committedly…
So, if the above is the answer – or are the answers – so far, where are the workings out?
My process is as follows:
- Draw
- Trainer form
- Pace profile
- Horse form
Here’s how I go about it:
Draw
For the draw, I go to the draw tab in the race card on Geegeez Gold, and select the going above and below today’s official going (e.g. if today’s going is good to soft, I’ll choose the range good through to soft). I then amend the runner range to be +/- 2 (e.g. if ten runners, I’ll select 8 to 12). These ranges are used to get better sample sizes from which to work. Clearly, by being less specific on going and field size I lose a little in terms of direct relevance; but my contention is that this is more than mitigated by the slightly higher confidence levels commensurate with a bigger dataset. I also use ‘actual draw’, i.e. number of stalls from box 1 after non-runners are considered. Anyhoo…
I then have some data in the IV column on the draw tab. IV, or impact value, is a measure of how much more or less likely something is to happen. In this case, it’s a measure of how much more or less likely a horse is to win when drawn in stall x based on the total population of runners in the sample.
I add that IV number to my spreadie and then, in an attempt to even out the individual starting stall IV’s, I take an average of the stall and its immediate neighbours. That is, for stall 1, an average of stall 1 and 2; for stall 2, an average of stalls 1 to 3; for stall 6, an average of stalls 5 to 7; and so on. To that, I add a little crass colour coding (what can I say, I find colour a very powerful visual aid…!)
It looks a bit like this.

Colour-coded average draw IV’s
The colour-coding is a bit rough and ready, and I’m obviously trying not to cherry-pick. That is, it makes no sense, for instance, to infer a positive impact from horses in stalls four and six, but negative impact for the horse in the stall between them. We need to be a little ‘real world’ here and look for general patterns. The averaging thing helps to some degree, but there remains inference in the process.
So, in the example above, I have a primary draw focus on those in stalls one to five. Note how the middle draws have fared less well historically in this example. The winner here was drawn five and, if I’d looked solely at individual draw, stall five’s IV of just 0.42 would have put me off. Even in this case, it remains daft to say that five is green/good while six is red/bad. With the exception of some tracks where stall 1 is a negative, it is generally the case that there is a steady diffusion of goodness/badness rather than absolutely/arbitrary cutoffs. But this is punting, and we need to take a view!
Trainer Form
I’m not certain I’ve got the best approach to evaluating draw, and that’s a comment which applies even more to my current method for trainer form. Here, I’m taking an average of the IV’s for each trainer’s 14 day, 30 day, course 1 year and course 5 year form. The problem here is that there is a very obvious ‘related contingency’: in plain English, the trainer’s 30 day form includes his 14 day form, and the trainer’s five year course form includes her one year course form. So that’s probably wrong. It might be better to add the average of the 14/30 to the average of the C1/C5, or to take an average of those two averages.
Moreover, I’m not currently factoring in the contextual form elements, such as trainer’s form with e.g. sprinters, or first run off a layoff or handicap first time, etc. That, too, is probably wonky.
Nevertheless, I have some data, which gives me a view of trainer form, and looks like this:

An approximation of trainer form is useful ballast
Pace Profile
Step 3 is to profile the pace in the race. How much is there overall, how is it spread across the field, and what are the individual horse’s pace profiles?
All of this can be gleaned very quickly by sorting the runners on the pace tab by draw. Here is how our example race looked on the pace tab:

Pace tab shows overall pace profile, historical performance, and individual pace preferences
There is a lot of information in this view.
First, in the green box, I’ve highlighted the historical pace performance of the different early run styles – with the going and runner ranges extended as discussed previously.
Second, in the blue box to the right, I’ve highlighted the runners’ average pace score for their last four UK/Irish runs (4 – led, through to 1 – held up).
And third, the view is sorted by draw (see left hand orange box) to give a visual perspective on how the pace might play out, based on the recent history of the runners in the field. In this case, there looked to be a bit of pace competition both high and low, where our draw research ssuggested those drawn on the flanks had the best record. Moreover, those who raced prominently or mid-division had fared marginally best in this sample (see the coloured blobs in the highlighted green box), though there seemed little in it.
That draw/pace profile hinted at Muscika, Black Isle Boy and My Name Is Rio.
Horse Form
The final piece in the puzzle is horse form. Clearly, this is a significant piece and, once the field has been whittled using draw and/or pace, the focus is keenly on what the animals have done. Trainer form is probably the least considered element at this stage in my testing, unless a handler is obviously bang out of, or in, form. [Trainer form is also the element which needs most further scrutiny just now, in terms of how I measure it].
I use Instant Expert, Full Form and the Card tab for the horse form part, and it feels like the one component which will be quite difficult to automate.
Here’s how the key components of my ‘race card’ looked in the spreadsheet [click the image to expand it].

Pulling all the elements together offers a pretty solid understanding of which horses have value chances
Looking back on this I probably got the pre-runner pace profile colouring wrong. It is generally my preference to favour early pace, as I have done here; but the historical profile suggested a slightly more restrained ride was often the way to go, and so it proved. Fortunately, there was enough in Black Isle Boy’s favour – especially at the price – to have a small interest anyway, though I feel I was somewhat lucky rather than good in this instance.
Why are you telling me this?
I mention all of the above for two reasons. One, a bit like the ‘secret’ to weight loss being diet and exercise, there is no secret to form study. It involves pulling all, or as many as possible, of the salient factors into a melting pot of deliberation. It takes time and effort, some of which can be automated.
Which segues nicely onto reason two: all of this content exists within Geegeez Gold, which means the process of automation is within our/my control. It’s on the wish list!
2. A R-r-r-r-r-ating?!
Ratings are tricky. Super tricky. There are times and places when they’re of huge utility, and there are other times when, in my opinion, they offer little to no value. For example, what use is a speed rating if the race looks likely to be run at a crawl? And what use is an ability rating if it fails to account for the specific race conditions on the day?
The best rating would accommodate such considerations and more besides; and it would learn to refine its number set as more evidence is presented. In point of fact, that’s largely how Peter May’s ratings, which we proudly carry here on Geegeez Gold, are derived.
And, in a weak moment, I got it into my noggin that I might create my own set of figures. Actually, it’s a recurring thought. But I know that this would become somewhat sisyphean (I’d love to name a horse, Somewhat Sysiphean!) – it would be a life’s work, and one almost certainly doomed to ignominious failure.
In spite of holding that contention in my saner moments, I did draw up the first (extremely) rough draft of ‘ground zero’ for a rating set. Here is it. Click for a full size view, and feel free to make a comment below. But please don’t ask questions!!

Some ‘fag packet’ thoughts on how a rating set might be constructed. Not. Straightforward.
Summary
So yes, oodles in the pipeline, some of it nearer / more realistic than others; all of it obliged to follow on from the major infrastructure work we’re currently undertaking. It’s going to be another exciting year ahead!
Matt
Leave a Reply
Want to join the discussion?Feel free to contribute!